Wednesday, 28 June 2017
Y12 - international migration - low-skilled labourers and elites
The clips from yesterday's lesson. Please make notes on what is happening and why

Thursday, 22 June 2017
Y12 - globalisation and megacity growth
Please use this link to complete the handout on megacity growth
BBC - megacities interactive
Then highlight the different statements into whether they are for (a) developed or (b) emerging/developing megacities
BBC - megacities interactive
Then highlight the different statements into whether they are for (a) developed or (b) emerging/developing megacities
Friday, 16 June 2017
Y12 - impacts of globalisation on ecology and biodiversity
For Tuesday:
Research and make notes on these three links. They focus on different impacts of China's rapid rise.
Infrastructure
https://www.theguardian.com/cities/2016/may/10/china-pearl-river-delta-then-and-now-photographs
Housing and social problems
https://www.theguardian.com/cities/2017/mar/20/changsha-changing-mao-growth-housing-services
Pollution and chemical leaks
https://www.theguardian.com/cities/2017/may/23/city-exploded-china-growth-tianjin-disaster-inevitable
For each of the links, please explore the interactive/time-lapse maps and also watch the drone footage for the last link
Research and make notes on these three links. They focus on different impacts of China's rapid rise.
Infrastructure
https://www.theguardian.com/cities/2016/may/10/china-pearl-river-delta-then-and-now-photographs
Housing and social problems
https://www.theguardian.com/cities/2017/mar/20/changsha-changing-mao-growth-housing-services
Pollution and chemical leaks
https://www.theguardian.com/cities/2017/may/23/city-exploded-china-growth-tianjin-disaster-inevitable
For each of the links, please explore the interactive/time-lapse maps and also watch the drone footage for the last link
Thursday, 8 June 2017
Y13 - FOR TOMORROW
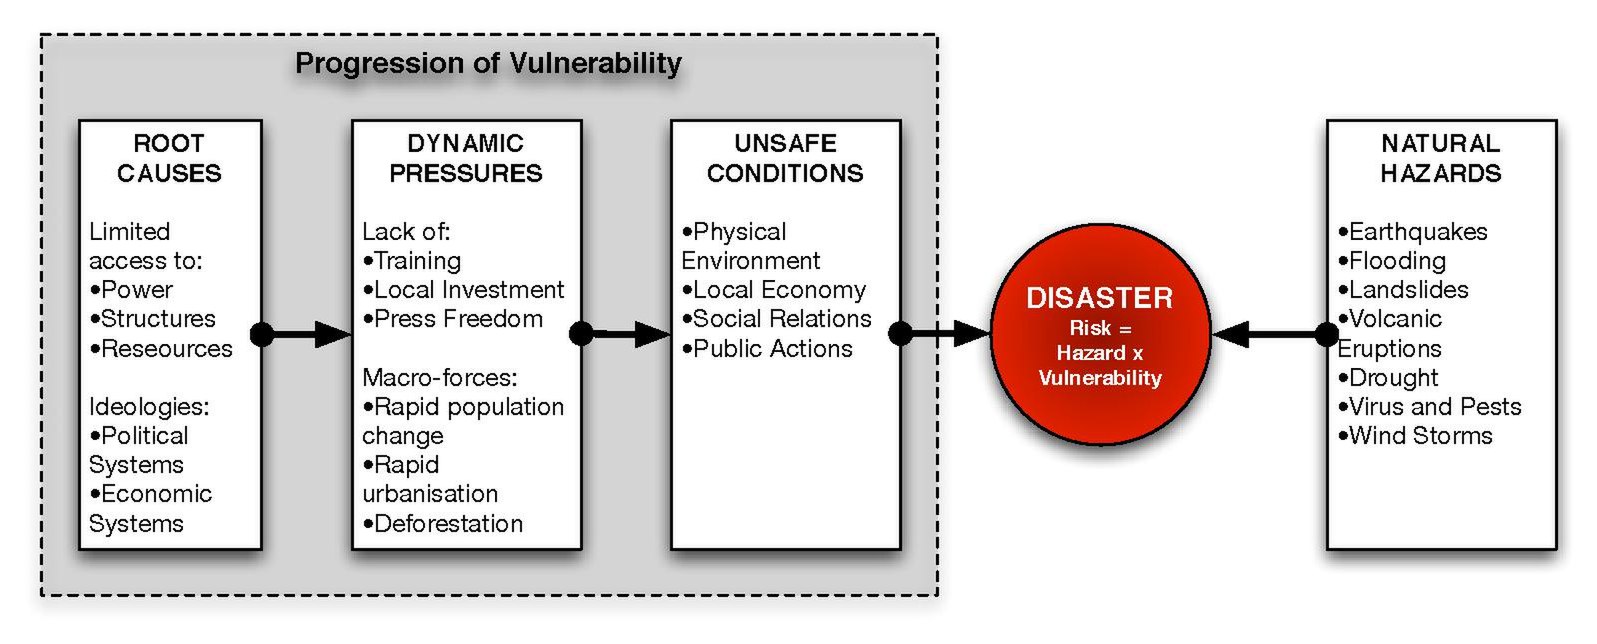
Learn this model - AT LEAST THE SUBHEADINGS and 1 or 2 of the topics. Reference it - (Blaikie et al, 1994)
https://en.wikipedia.org/wiki/File:PAR_model.pdf
Then, learn all the main facts for our case studies.
Tohuku 2011, Japan,
Nevado Del Ruiz 1985, Colombia
Eyaffajokul 2010, Iceland
Pinatubo, 1991, Philippines
Haiti, 2010
Mt St Helens, 1980, USA
Italy 2015/16
Indian Ocean Tsunami, 2004
Memorise the names of sources - at least 5.
Memorise the names of websites & organisations - eg. "Corruption Perception Index, Transparency International - NGO".
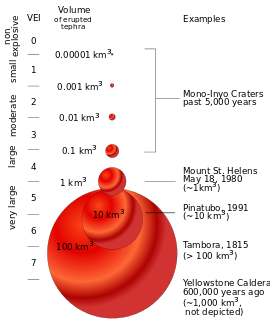
Learn the VEIs of Pinatubo, Nevado Del Ruiz, and Eyafajjallokul
https://en.wikipedia.org/wiki/Volcanic_Explosivity_Index#/media/File:VEIfigure_en.svg
https://en.wikipedia.org/wiki/File:PAR_model.pdf
Then, learn all the main facts for our case studies.
- Plate tectonic cause
- year
- magnitude (Richter & VEI)
- social cost (no. dead)
- economic cost
- environmental cost (eg. 2 million trees [Mt St Helens])
Tohuku 2011, Japan,
Nevado Del Ruiz 1985, Colombia
Eyaffajokul 2010, Iceland
Pinatubo, 1991, Philippines
Haiti, 2010
Mt St Helens, 1980, USA
Italy 2015/16
Indian Ocean Tsunami, 2004
Memorise the names of sources - at least 5.
Memorise the names of websites & organisations - eg. "Corruption Perception Index, Transparency International - NGO".
Learn the VEIs of Pinatubo, Nevado Del Ruiz, and Eyafajjallokul
https://en.wikipedia.org/wiki/Volcanic_Explosivity_Index#/media/File:VEIfigure_en.svg

Sunday, 28 May 2017
Y12 - Globalisation - half term work
The half term work comes in two parts:
1. To complete the work we began on 'switched off' and 'switched on' places around the world, answer this question. Write a detailed paragraph (half a side) with 2 examples for each of the four factors.
"Analyse the physical, political, economic, and environmental reasons why some locations are 'switched off' from globalisation".
To reach the higher levels, remember to pick holes in your own points. So, just after having mentioned Nepal and how it's landlocked, you then do a big "however" and mention Switzerland, and try to explain why, in this case, being landlocked is not a problem.
Use the KOF map of globalisation to find some examples.
2. Download the PDF file from this link Global Shift PDF
a) define the global shift
b) identify the causes/what has enabled it to happen
c) mindmap the impacts on China and India
1. To complete the work we began on 'switched off' and 'switched on' places around the world, answer this question. Write a detailed paragraph (half a side) with 2 examples for each of the four factors.
"Analyse the physical, political, economic, and environmental reasons why some locations are 'switched off' from globalisation".
To reach the higher levels, remember to pick holes in your own points. So, just after having mentioned Nepal and how it's landlocked, you then do a big "however" and mention Switzerland, and try to explain why, in this case, being landlocked is not a problem.
Use the KOF map of globalisation to find some examples.
2. Download the PDF file from this link Global Shift PDF
a) define the global shift
b) identify the causes/what has enabled it to happen
c) mindmap the impacts on China and India
Monday, 22 May 2017
Y12 - measuring globalisation
Read p.162-163. Mindmap the ways the KOF index and the A T Kearney Index measure globalisation.
Which is a better measure? Explain your decision.
Next, use this KOF map to mindmap/create a table showing the physical, environmental, political, economic factors that explain 'switched on' and 'switched off' places around the world. Use examples!
Eg: (under 'physical') Nepal - mountainous - lack of internet infrastructure; landlocked - no ports for access to trade routes.

Which is a better measure? Explain your decision.
Next, use this KOF map to mindmap/create a table showing the physical, environmental, political, economic factors that explain 'switched on' and 'switched off' places around the world. Use examples!
Eg: (under 'physical') Nepal - mountainous - lack of internet infrastructure; landlocked - no ports for access to trade routes.

Wednesday, 5 April 2017
Y13 - Thursday 6th April
For today's lesson we aim to complete a Unit 2 mock (the paper I gave you yesterday). The aim is to complete this paper in the double lesson - remember that the real exam gives you just 1 hr 15 min.
We need to aim for speed and accuracy in our writing, hence why we are using the essay plans we created overnight.
When you have finished these, please leave them on my desk.
Best of luck
Subscribe to:
Posts (Atom)